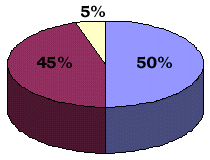
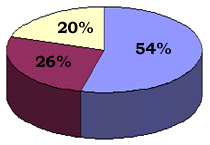
Who belongs to PTRA, and what do our members want from the Association?PTRA surveyed its membership in 1998, both to develop a better profile of the companies who belong, and a better understanding of how well we are serving our two constituencies –
It quickly became obvious when the survey results were tabulated that both categories take PTRA seriously. Almost two-thirds of the members – both Representatives and Principals – took the time to fill out and return their questionnaires. This not only gives us confidence in the validity of the statistics, but even more in the importance these companies place on their membership. Let’s profile our Representative members first. Virtually all are president/owner/ceo of their firms, and they have been members of PTRA for 11.6 years on average. About 15% have joined in the past three years, and an equivalent number have been members for over 20 years. This tends to correlate to the length of time they have been in business.
Not surprisingly, the older firms tend to be the larger firms. Annual sales for all Representative members average $8.5M, while firms that have been members more than eleven years average $9.8M. Annual revenues average $739,000, or just under 10% of sales; but 53% of the respondents report their revenues are $500,000 or under.
On average, PTRA Representative members have 3.5 outside sales employees, and 2.2 inside sales. Just over half of the PTRA members maintain warehouses, and those that do have an average of 2.3 employees. PTRA members are computer-literate, with about 75% using computers for sales analysis, customer contact management, and accounting. Longer term members are more likely to take full advantage of PTRA programs, especially annual Conference attendance and other educational opportunities. Some 84% also attend IDEAS training programs, and close to half the respondents have completed or are enrolled in the Certification program of the Manufacturers’ Representatives Educational Research Foundation. Just over half maintain membership in MANA alongside their PTRA membership. To keep current, about two – thirds read PT Distributor, PT Design, and Agency Sales, about half read Industrial Distribution, and about a third read Today’s Distributor. Now let’s look at the characteristics of our Principal members. As you might expect, they are larger companies, with average annual PT/MC sales of $25,684,000, and with an average of 348 employees. They have been in business on average 40 years, boasting nearly twice the longevity of their rep firms. Almost all of them (87%) are publicly owned. About half of them are also members of PTDA, which correlates with deriving 50% of their sales from distribution. Their products sold in the U.S.A. are overwhelmingly made in the U.S.A. (69%).
On average, Principal members work with 14 rep firms, and half have had their rep firms five years or less. Four out of ten also employ a direct sales force. The executives who participate in PTRA are largely (73%) sales and marketing oriented; only 27% are in the president/owner/ceo category. |


